
Gemini is Google’s AI assistant. In a product announcement dated 20 October 2026, Google announced a dedicated landing page for small businesses and introduced the ability to turn spreadsheets, receipts and purchase records into financial charts and interactive models.
For readers with no background in AI, the point goes beyond having charts drawn for you: you can ask AI to help organise scattered figures, then check how it reached its conclusions. However, a professional-looking chart does not mean the data has been verified, let alone audited.
How could you use it? Three types of questions
The following are suggested applications based on the feature, rather than results from hands-on testing for this article:
- Break down expenses: Divide spending into categories such as goods, transport and marketing to see which accounts for the largest share. This requires clear classification rules and each record being counted only once.
- Compare different months: Examine changes in revenue or costs. The comparison must use equivalent periods and the same currency; a month that has not ended cannot simply be treated as a complete month.
- Explore the effect of changing conditions: For example, examine how the remaining balance would change if the cost of goods rose while sales volume stayed the same. This is a scenario calculation, not a prediction that the situation will definitely occur.
The financial features section in Google’s original announcement supports the ability to organise data into charts and interactive models; the task designs above are editorial suggestions. Whether they can be completed in practice still depends on the features available to the account, the input data and the quality of the output.
Separate three layers: reading correctly, calculating correctly and making sound judgements
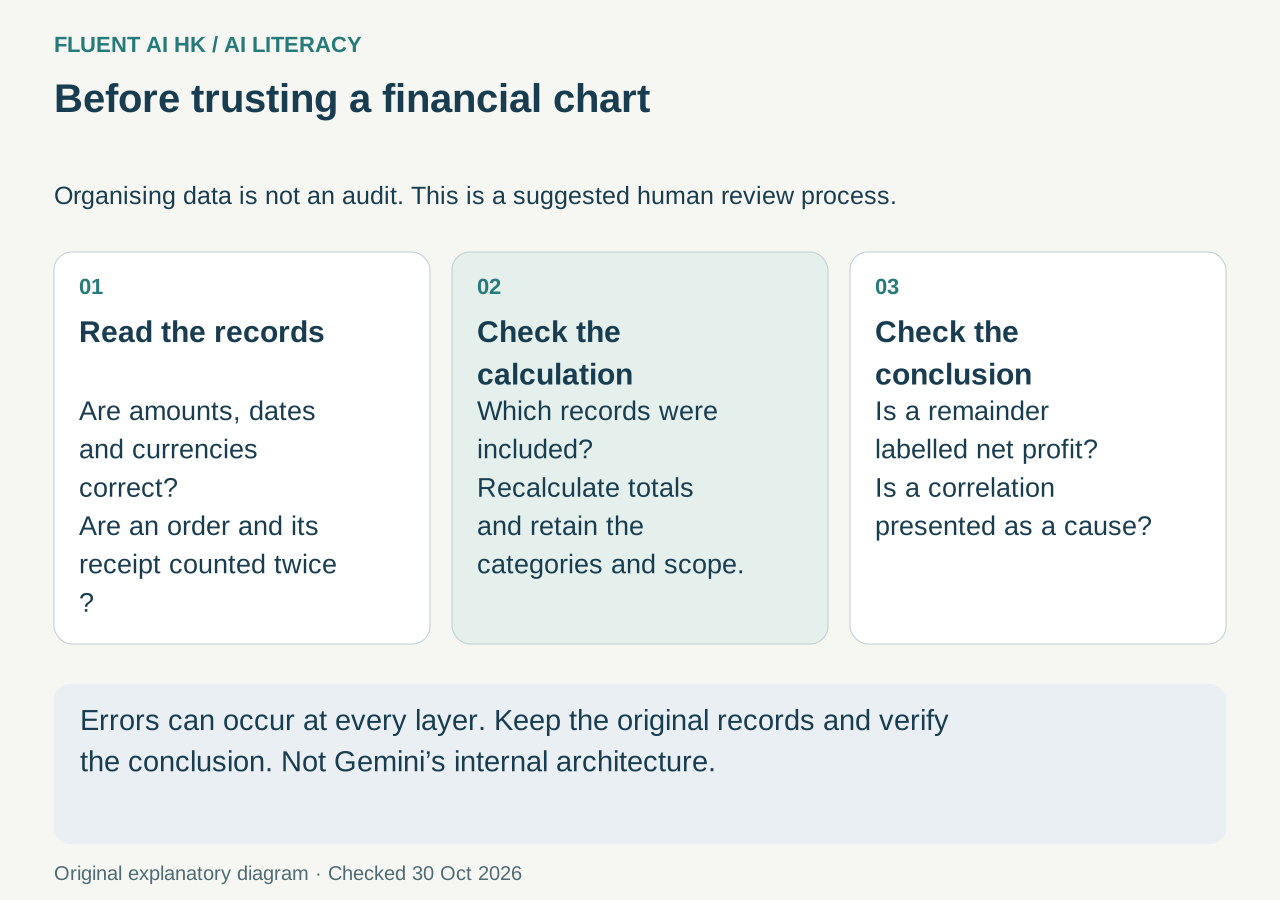
The first layer is recognising the data. Has the amount on the receipt been read correctly? Is the date the purchase date or the payment date? Could an order and a receipt for the same transaction be treated as two separate expenses? If this first step goes wrong, the charts that follow will also be wrong.
The second layer is calculation. Even if every figure is correct, the scope of the total may still be wrong. For example, a chart might use only some months but be interpreted as showing a full-year trend. You therefore need to check which records, units and calculation methods were used.
The third layer is business judgement. “Revenue minus a few known costs” is not necessarily net profit. Likewise, if revenue rises after marketing spending increases, that before-and-after change alone does not establish that marketing caused all the growth.
This human review process can help explain how the three layers relate:
Original records → Check recognition and classification → Recalculate key figures → Check whether the conclusions go beyond the data → Decide whether to use the results
This is a suggested workflow, not a description of Gemini’s internal operation.
Workplace example: why a remaining balance is not necessarily profit
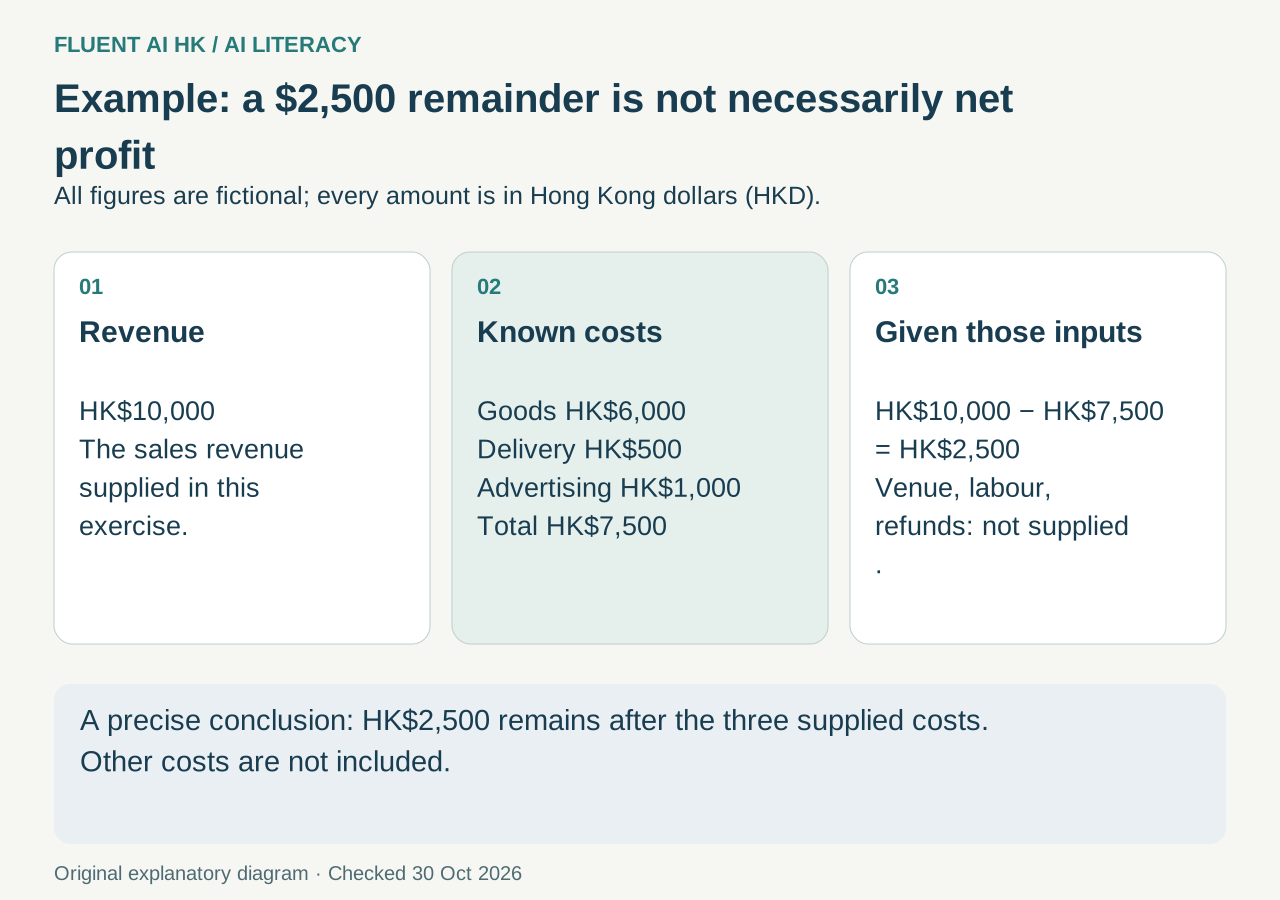
The following figures are purely for practice, and all amounts are in Hong Kong dollars (HKD): an event has sales revenue of $10,000, goods costs of $6,000, shipping costs of $500 and paid advertising costs of $1,000.
Subtracting only these three costs leaves $2,500. If AI names the chart “Event net profit”, you need to ask: are there venue costs, labour costs, refunds or other costs that have not been included? The absence of information does not mean these items do not exist.
A more careful statement would be: “Based on the three costs provided, the remaining balance is $2,500; other costs are not included.” This preserves the useful result without presenting incomplete data as a complete answer.
Try a checking exercise yourself
If your account already provides the required features, you can practise with the fictional figures above without uploading real company accounts.
- Establish a reference answer first: Calculate the $2,500 yourself and note which cost information is still missing.
- Ask for the basis of the answer: Ask the tool to list the figures, classifications and calculation methods it used, then explain the chart. Do not look only at the final conclusion.
- Add a duplicate record: Add a copy of the receipt for the same $500 shipping expense and observe whether it flags a possible duplicate or subtracts the amount again.
- Assess each point: Were any amounts read incorrectly? Was anything counted twice? Were unknown items treated as zero? Did the conclusion explain the scope of the data?
Even if every answer is correct this time, that only means it passed this small test. It does not establish that it is equally reliable with all accounts.
What else should you check before starting?
The official announcement also lists connected apps such as Google Workspace and Xero. However, listing app names does not mean every account can already use all the connection features. The product announcement checked as of 30 October 2026 did not specify Hong Kong account eligibility, plan fees or the full setup steps individually. This article therefore demonstrates only how to check figures. It does not promise that any particular account can use the features for free or already has access to all of them; before adopting the tool for actual work, check the availability conditions that apply to the account at that time.
Before using real data, confirm whether your company permits uploading it and which data the tool will be able to access. Fictional records are suitable for introductory exercises; for actual work, keep the original supporting documents so the responsible colleagues can review them.
This official announcement supports the capabilities the product claims, but it is not an independent accuracy test. A key part of understanding AI is distinguishing “can produce analysis” from “produces analysis worth using”. To continue building a foundation in choosing tools, asking questions and verifying results, start with Fluent AI HK’s free 12-chapter AI course.
Join the discussion
CommunitySign in to share an idea or question. Comments appear after review.
Sign in to comment